


How to read a mapping study
A report with heat maps and tables is not hard to read when you know what to look for. Here is the order.

Kim Djurhuus, founder
9 min read
The map before the numbers
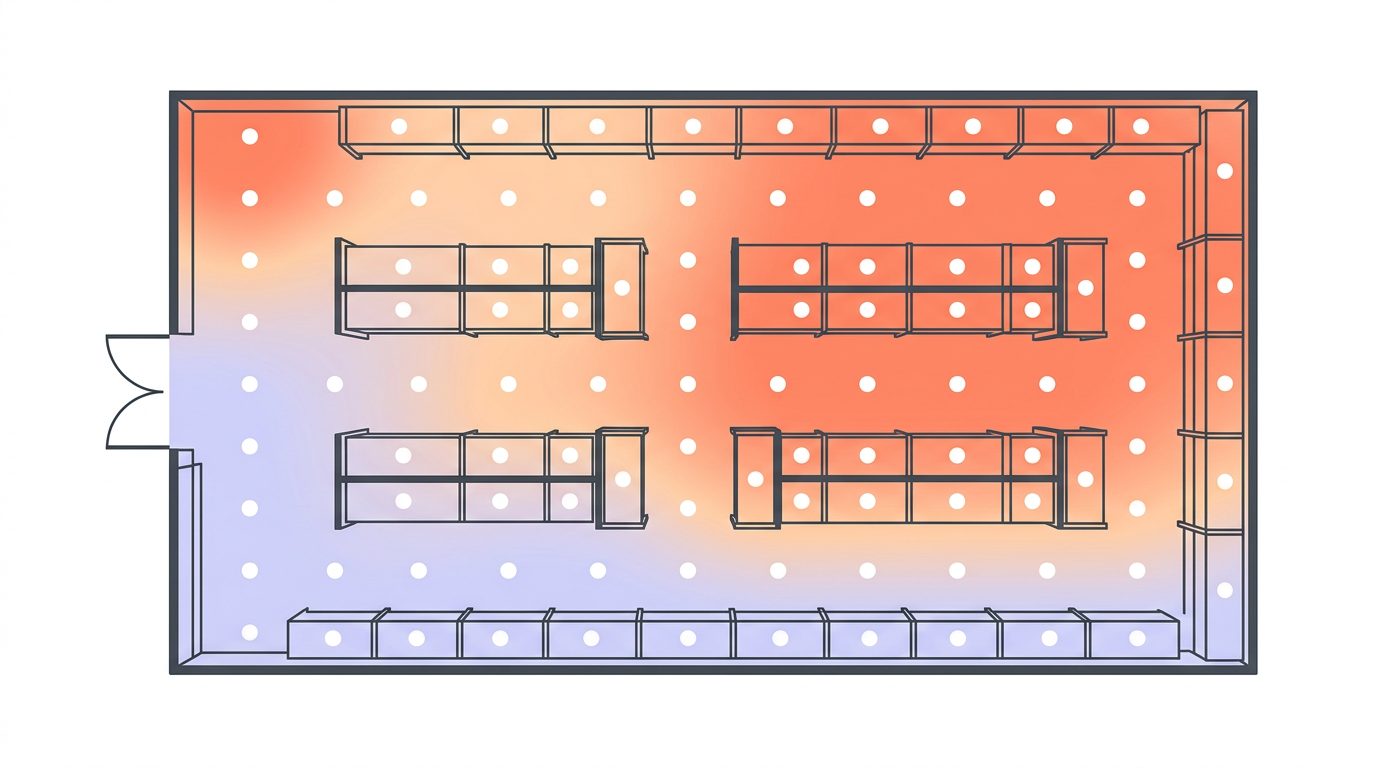
Start with the heat map. It shows the distribution with colour instead of numbers, and it reveals in a few seconds whether the difference in the room is small or large.
If the map is almost a single colour, the rest of the report is a formality. If there are clear zones, that is where the work lies.
Is there a difference at all?
The first question is not where the warmest point is. It is how large the difference between the points is.
If the span between the coldest and warmest point is half a degree, the placement of the fixed sensor hardly matters. If it is three degrees, the placement means everything.
That figure appears in the report as the difference between the lowest min and the highest max across the points.
Where are the extremes?
The warmest point is typically where the fixed sensor should be placed, because that is where the product is first at risk.
At the same time, check whether the extremes are in a place where a sensor can practically be mounted. If the warmest point is in the middle of a driving aisle, the next best place must be found, and that must be justified in the report.
An extreme point that cannot be used in practice is still a result. You just need to document why the sensor sits somewhere else.
When did the fluctuations happen?
Raw data over time shows whether the fluctuations coincide with something. A jump every morning is rarely the cooling system, it is loading work.
If there is a rise every six hours at all points at the same time, it is typically defrosting.
That is what determines the delay on the alarm limit afterwards. Without raw data, the delay becomes a guess.
Are the acceptance criteria met?
In the report's comparison, your own acceptance criteria are set against what was measured. If all points are within, the room is documented as suitable.
If a point is outside, it is not necessarily a problem with the room. It may be a matter of moving goods away from that particular spot, or of adjusting the system.
The assessment is yours. The report provides the basis, not the conclusion.
What the report does not answer
It does not say how many fixed sensors you should have. It says where they should sit once you have decided on a number.
Nor does it say whether you should map again, and when. That follows from your own SOPs and from how much changes.
Things to look for, in order

The span
The difference between the lowest min and the highest max. Determines how much placement matters.

The extremes
Where it is warmest and coldest, and whether a sensor can practically sit there.

The time pattern
Do the fluctuations coincide with loading work, door openings or defrosting?
Frequently asked questions
What is a heat map?
A visual representation of the distribution in the room, where colour replaces numbers. It makes it possible to see zones immediately.
Why does it show min, max and average?
The average tells you about the normal state, min and max about the extremes. It is usually the extremes that determine the placement.
What if a point is outside the acceptance criteria?
It is an observation, not necessarily a problem. Assessing the consequence is up to you.
Can we use the report for an inspection?
Yes. That is exactly what it is for, and it must be readable without further explanation.
Who writes the acceptance criteria?
You do, in the mapping plan, before the study starts.
Read on

Temperature mapping
We carry out the mapping ourselves: plan, measurements, heat maps and report, ready for inspection.
Read about temperature mapping →Why a sensor drifts
What drift means, why it happens, and what calibration solves.
Read the article →
Why your alarm does not work
The three most common mistakes in alarm setup, and what they cost.
Read the article →Kom hurtigt i kontakt med den rette specialist.
Vi hjælper med alt fra nye monitoreringsløsninger til kalibrering, validering og teknisk support.
Generelle henvendelser

Nye projekter
IT & teknik
Administration
Besøg os
Måløv Byvej 229
2760 Måløv
Ring til os
+45 72 22 02 05
Man-fre, 08-16
Fortæl os, hvad du har brug for.
Vil du se, hvordan det ser ud hos jer?
Book en gennemgang. Vi kommer forbi, ser på udstyr og lokaler og rådgiver om, hvor følerne skal sidde. Derefter får du et skræddersyet forslag. Uden forpligtelser.
Book en gennemgang