


Temperature mapping
A mapping study shows what the temperature actually is throughout the room, not just where the sensor happens to be. We carry out the study, document it and tell you where the sensors should go afterwards.
What is temperature mapping?
A mapping study measures how temperature and humidity are distributed in a room or a piece of equipment over time. A number of calibrated sensors are placed according to a plan, run for an agreed period and the result is documented. The study shows where the warmest and coldest points are, and that is where the fixed sensors should go afterwards.
Mapping is typically done before commissioning, after major changes and at regular intervals, often as summer and winter mapping, because the season moves the warmest point.
One sensor in the middle does not tell you what happens at the door
In a cold room there can be several degrees of difference between floor and ceiling, between back wall and door, and between summer and winter. If you put the sensor where it is easiest to reach, you are probably not measuring the place where the product is at risk.
It is also what an auditor asks: how do you know the sensor is in the right place? Without a mapping study, the answer is an estimate.
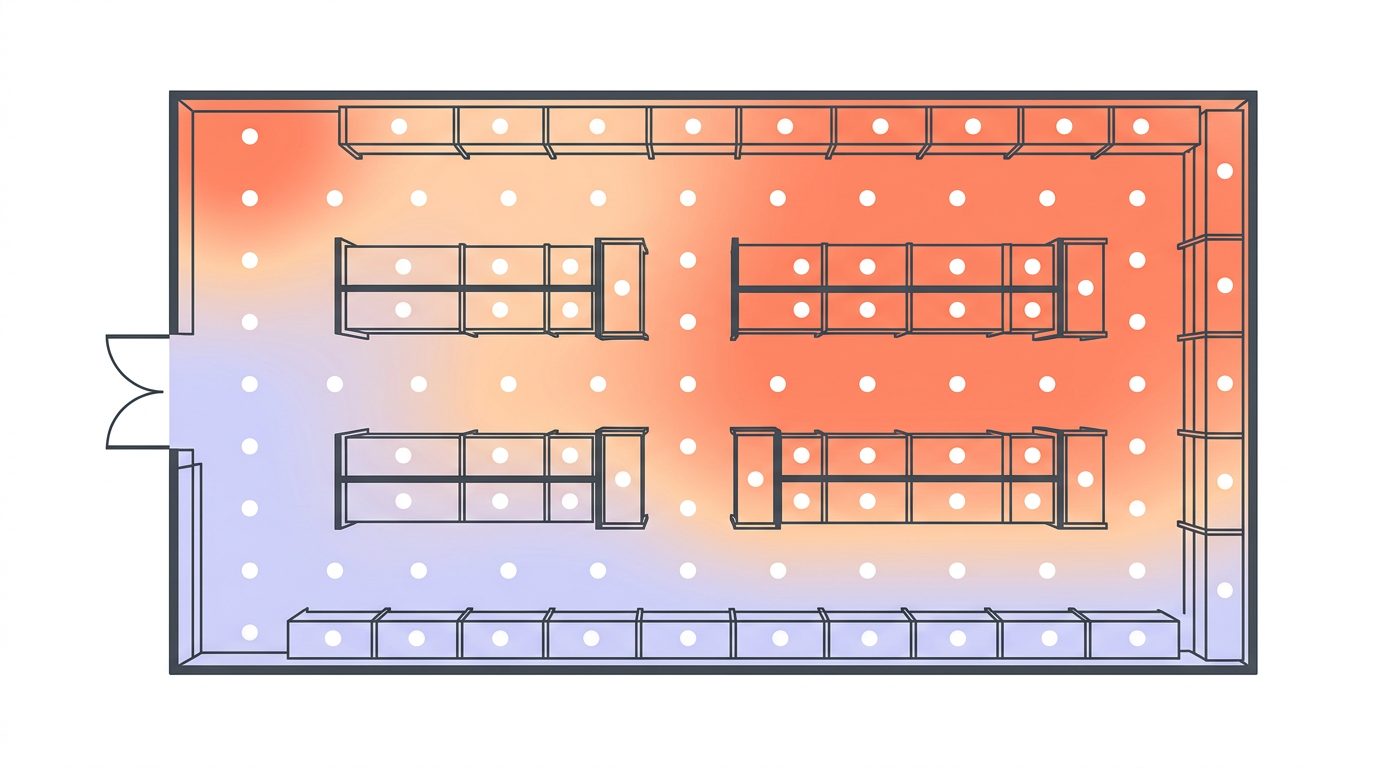
With a study, the answer is a document with heat maps, measuring points and a justified placement.
Four steps to a placement you can defend.
We plan the study together with you, run it during normal operation and deliver a report that shows where the sensors should go.
Plan
We go through the room, determine the number of loggers, placement and duration, and write the mapping plan together with you.
Study
Calibrated sensors are placed according to the plan and run during normal operation. Data is followed live, so a misplaced point is spotted straight away.
Report
Heat maps, min, max and average per point, and timestamped raw data. Readable without further explanation.
Placement
We go through the report with you and recommend where the fixed sensors should go. Based on data, not estimates.
What we map

Cold rooms and warehouses
Large rooms with several zones. Typically where the difference between points is greatest.
Read more →
Refrigerators and freezers
Individual equipment, where placement in the cabinet decides what the sensor measures.
Read more →
ULT freezers
-80 degrees, where even a few degrees of difference matters for the samples.

Stability chambers
Long studies where both temperature and humidity must be documented across the whole chamber.

Storage rooms
Distribution of temperature and humidity across zones and airlocks.

Vehicles
Cargo areas and cool bags, where the load moves and doors are opened along the way.

Summer and winter
Same room, two seasons. The warmest point moves, and that has to be documented.
Read more →
After changes
New fittings, new ventilation or a new layout can shift conditions noticeably.
What you get
The report is what remains once the loggers are packed away. It must be readable by an auditor without further explanation.

Mapping plan
Number of sensors, placement, duration and acceptance criteria, agreed in writing before the study starts.

Heat maps
Visual distribution of temperature and humidity, so the warmest and coldest areas, as well as the highest and lowest humidity levels, can be seen straight away.

Timestamped raw data
Every measurement from every logger, exportable as PDF and CSV, with a calibration certificate for each sensor.
Justified recommendation
Where the fixed sensors should go, and why. That turns the placement into an argument instead of an estimate.
De bruger os allerede








What a result looks like
A heat map shows the distribution in the room with colour instead of numbers, so the warmest and coldest points can be seen straight away.
Below the map are the raw data per point with min, max and average, and that is what the placement recommendation is based on.
How to read a mapping study →OCEAView
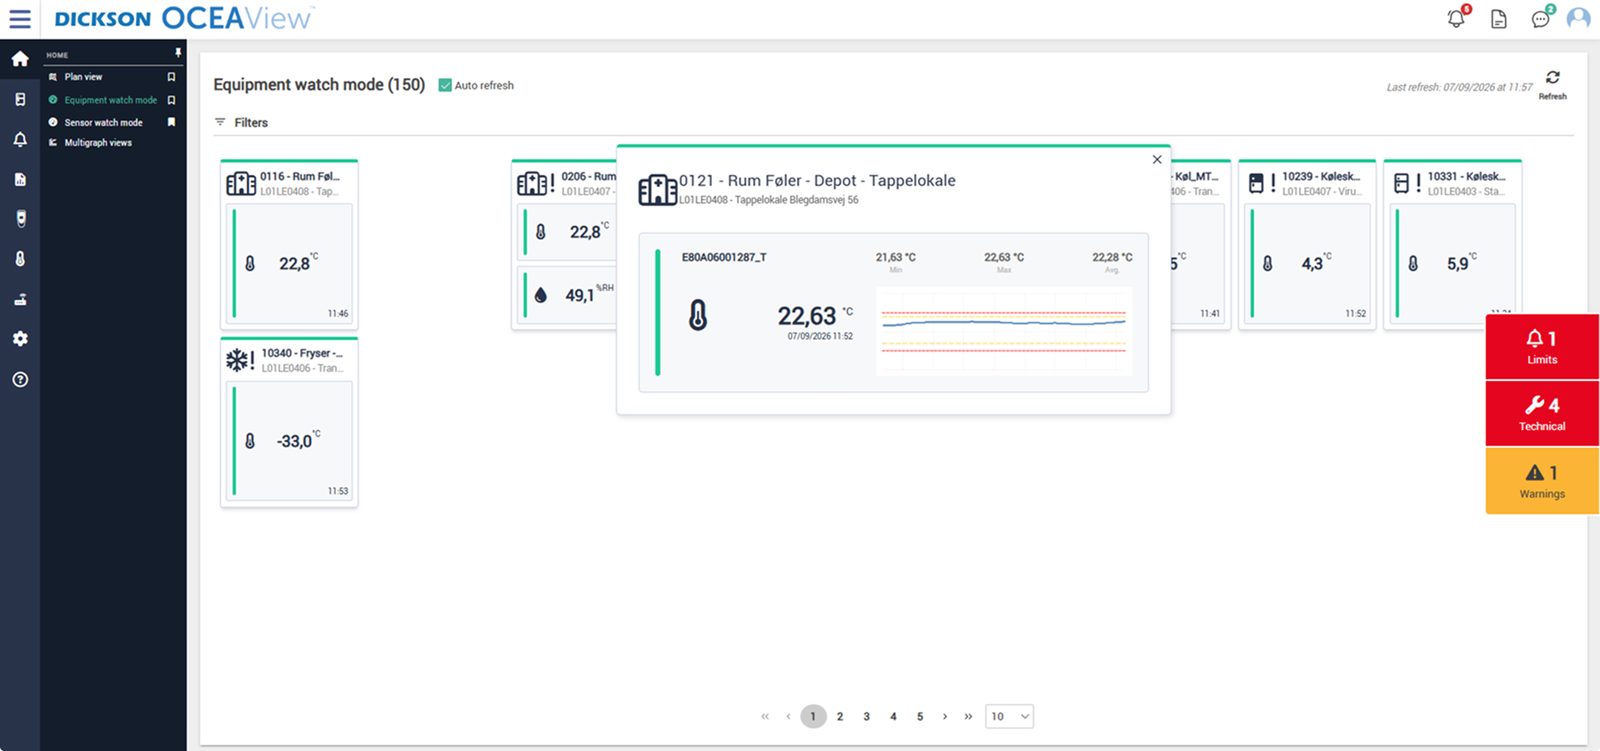
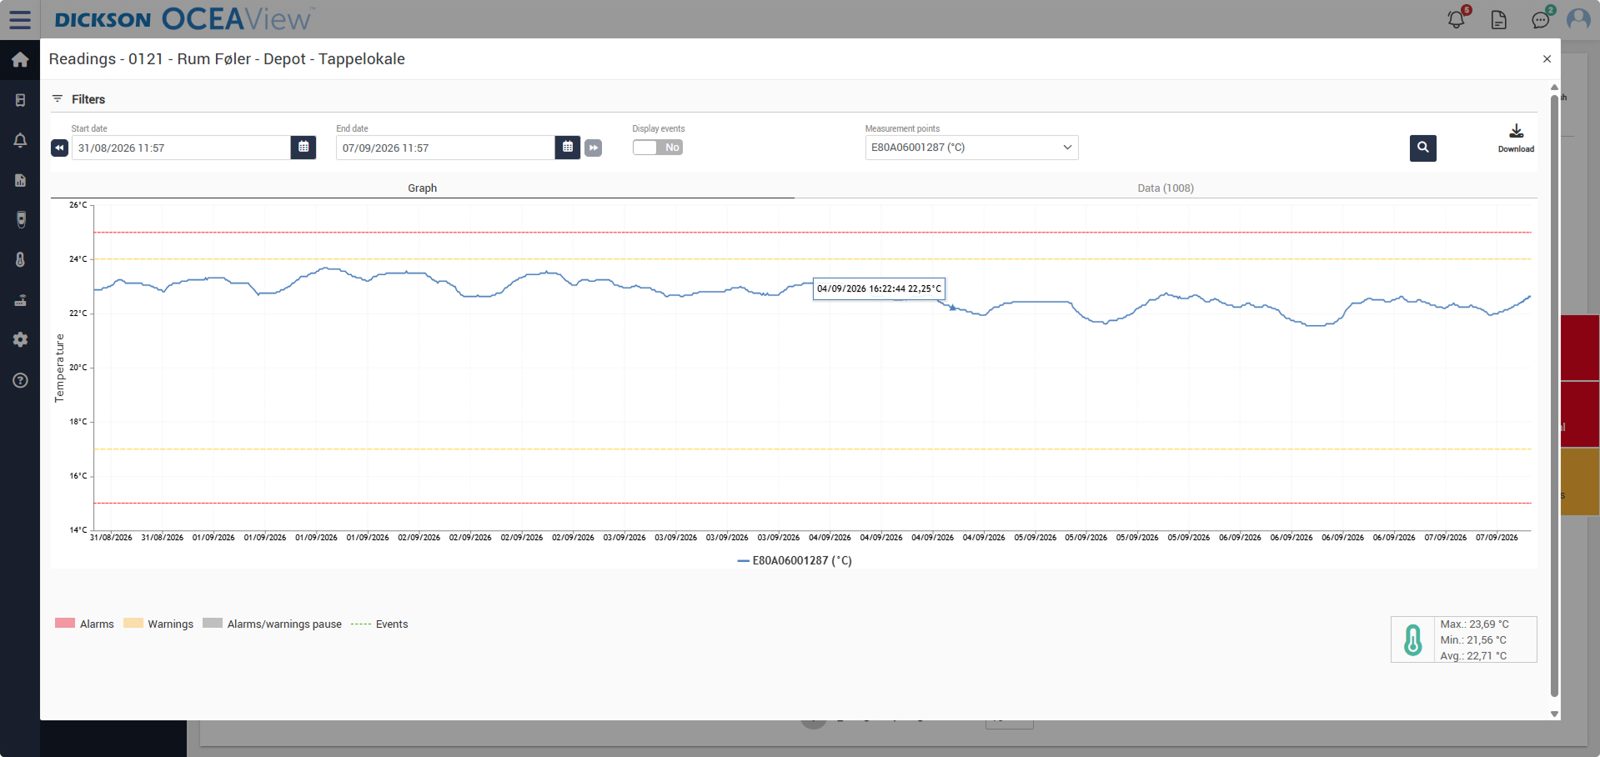
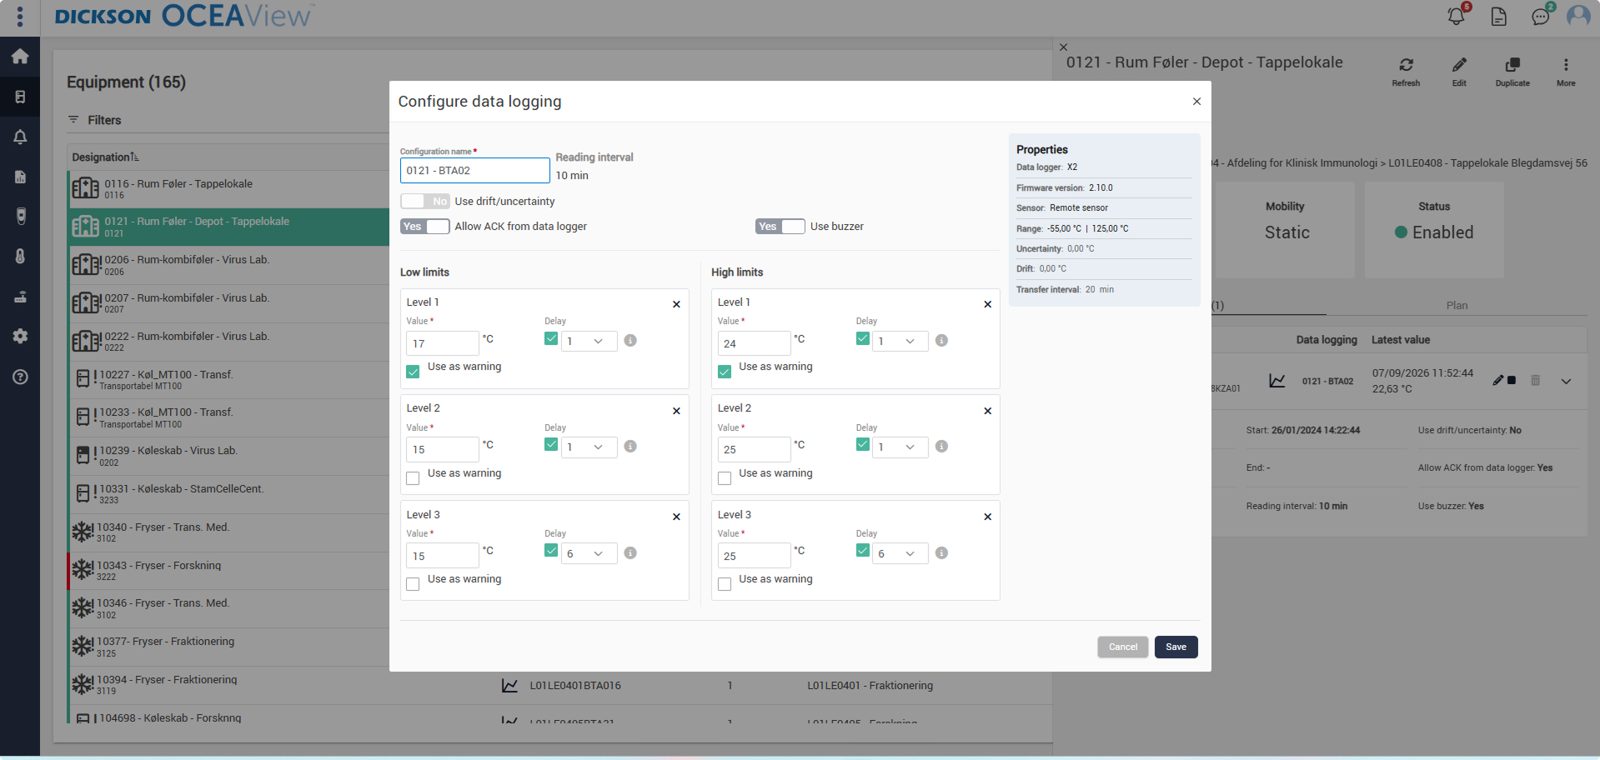
Mapping data and the fixed monitoring sit in the same system. The study does not become a report in a drawer, it becomes the basis for the measuring points that carry on running.
Watch mode and Plan View
Graphs and reports
OCEAlert
Frequently asked questions
How many sensors are needed?
It depends on the size of the room, the number of zones, air circulation and your own requirements. A small refrigerator needs only a few points, a cold room typically requires 16 or more. We set the number in the mapping plan before the study starts.
How long should a study run?
Long enough to cover the fluctuations that actually occur. For a room in daily use, that typically means several days, so working days, nights and weekends are all included.
Do we need to map both summer and winter?
If the room is affected by the outdoor temperature, yes. The warmest point in winter is rarely the same as in summer, and a study from January does not document July.
When should we map again?
Typically at a fixed interval according to your own SOPs, and always after changes to layout, ventilation, fittings or load.
Do operations have to stop in the meantime?
No. The loggers are placed in the room, and your day-to-day work carries on. It is precisely during normal operation that the measurements are representative.
Is mapping connected to the fixed monitoring?
Yes. The mapping study tells you where the fixed sensors should go. Without it, the placement is an estimate, and that is hard to defend to an auditor.
Related services and requirements

Calibration
Accredited calibration of the sensors via partners, managed and planned by us.
Read more →
Wireless monitoring
The fixed measuring points after the study, with no cables through walls.
Read more →GDP and storage
The requirements for documented conditions where medicines are stored.
Read more →GMP warehouses
Monitoring and mapping of warehouses in the pharmaceutical industry.
Read more →Kom hurtigt i kontakt med den rette specialist.
Vi hjælper med alt fra nye monitoreringsløsninger til kalibrering, validering og teknisk support.
Generelle henvendelser

Nye projekter
IT & teknik
Administration
Besøg os
Måløv Byvej 229
2760 Måløv
Ring til os
+45 72 22 02 05
Man-fre, 08-16
Fortæl os, hvad du har brug for.
Vil du se, hvordan det ser ud hos jer?
Book en gennemgang. Vi kommer forbi, ser på udstyr og lokaler og rådgiver om, hvor følerne skal sidde. Derefter får du et skræddersyet forslag. Uden forpligtelser.
Book en gennemgang