


Products from DICKSON

OCEAView solution provides best-in-class remote monitoring, data traceability and alert notification based on DICKSON innovative wireless sensors and a web platform for implementing flexible, connected and auditable monitoring systems for all your needs. We offer both a public cloud solution and an on-premise private cloud solution.
View products
Smart sensors
DICKSON supplies a wide range of its own purpose-designed Smart-Sensors for monitoring various physical parameters. DICKSON Smart-Sensors offer maximum reliability and unprecedented ease of use.
Sensor memory
contains calibration correction coefficients (a/b or a/b/c), measurement uncertainty after calibration, drift after 1 year and the sensor's serial number

Unlimited possibilities
To ensure maximum flexibility, DICKSON has developed several smart-sensor converters and adapters that make it possible to monitor many kinds of equipment, including specialist equipment from other suppliers, integrated in the OCEAView application
Cell production units
Integrate highly advanced equipment such as CliniMACS Prodigy® systems with 4-20mA or 0-10v

Selected sensors & equipment
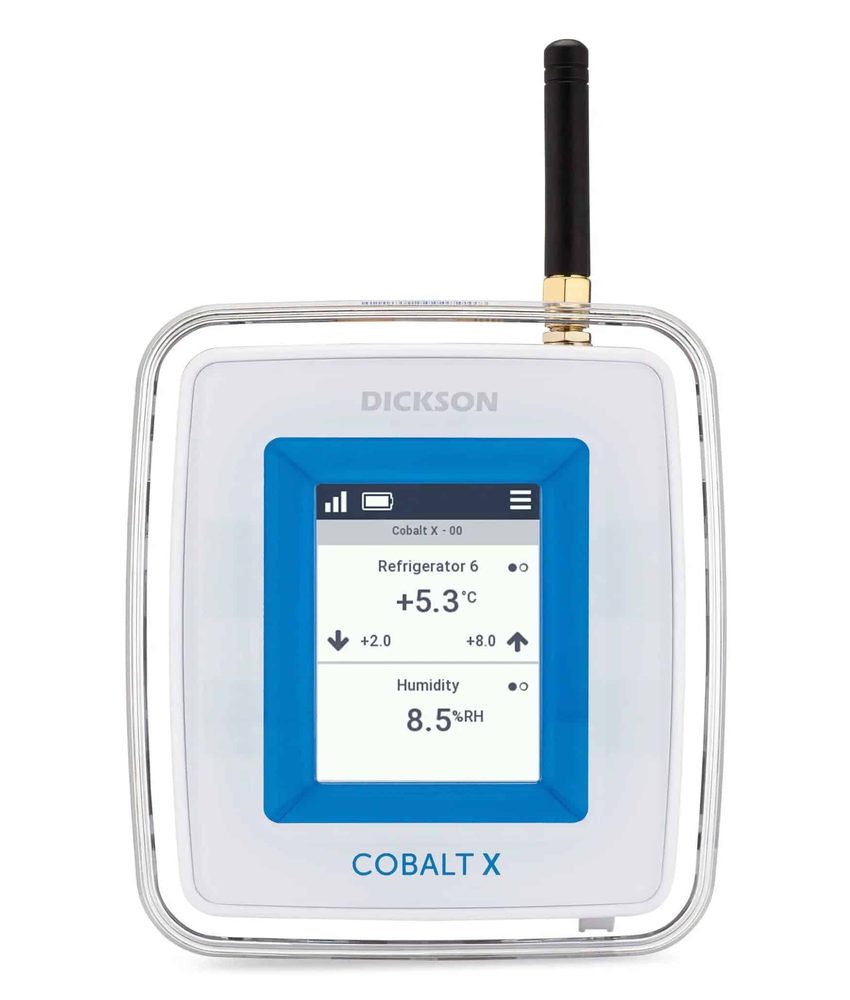
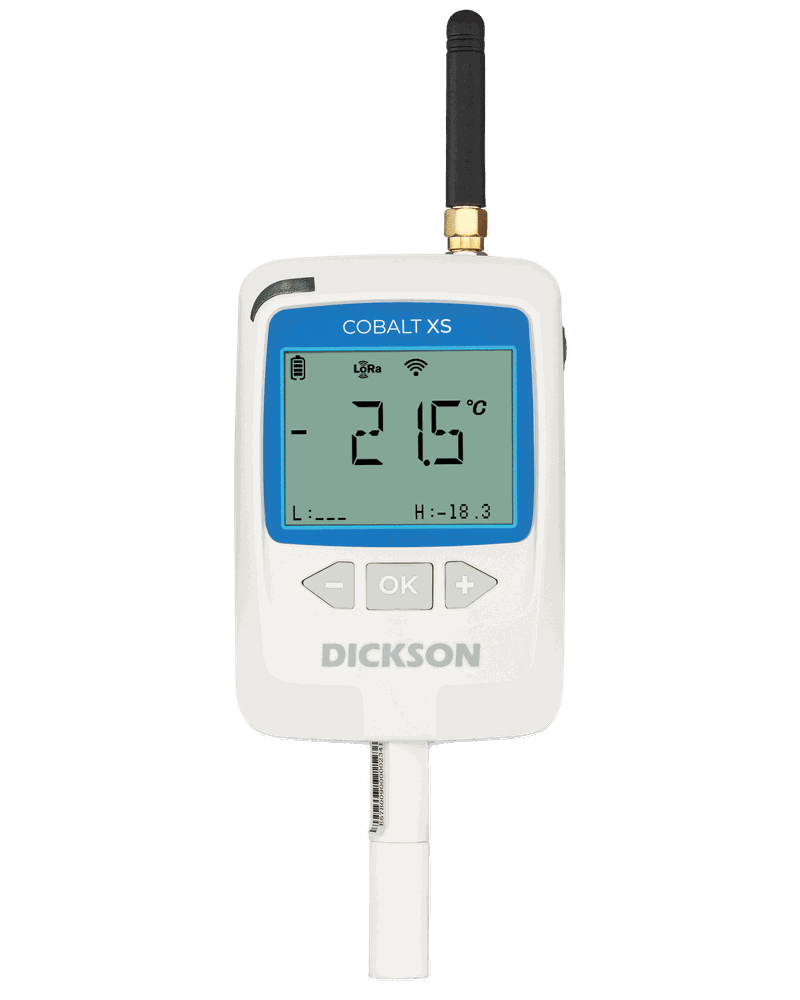
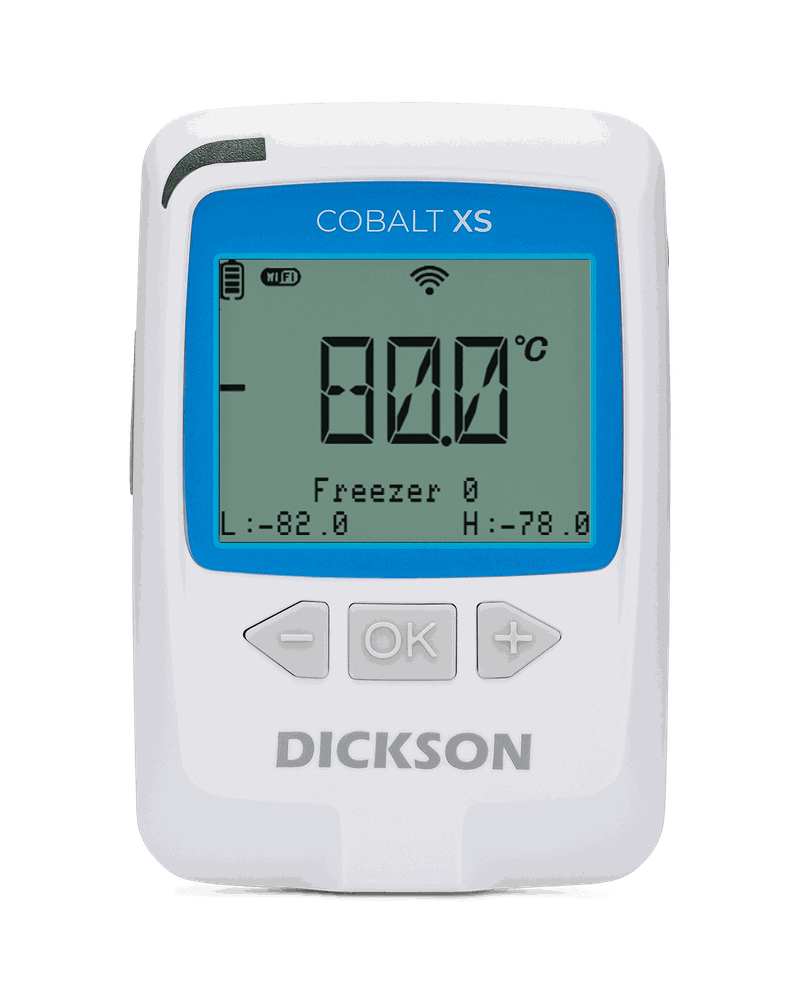
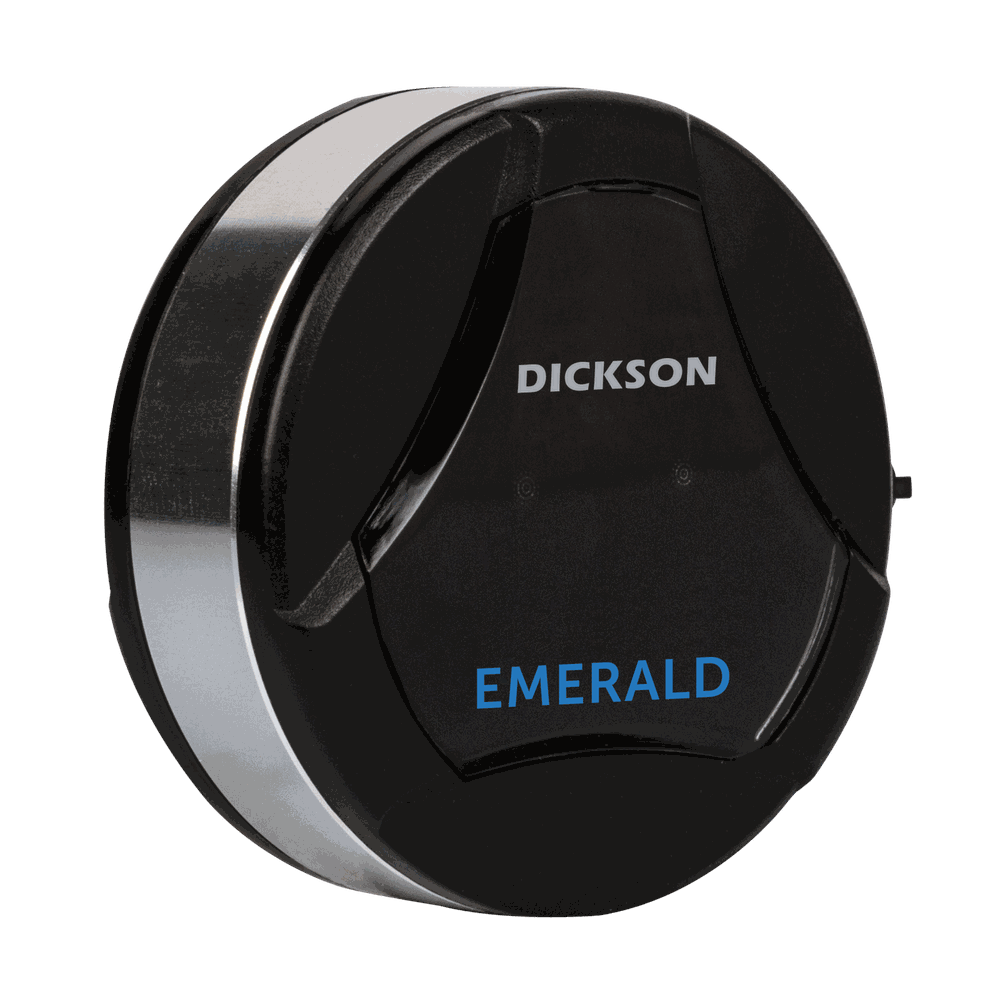
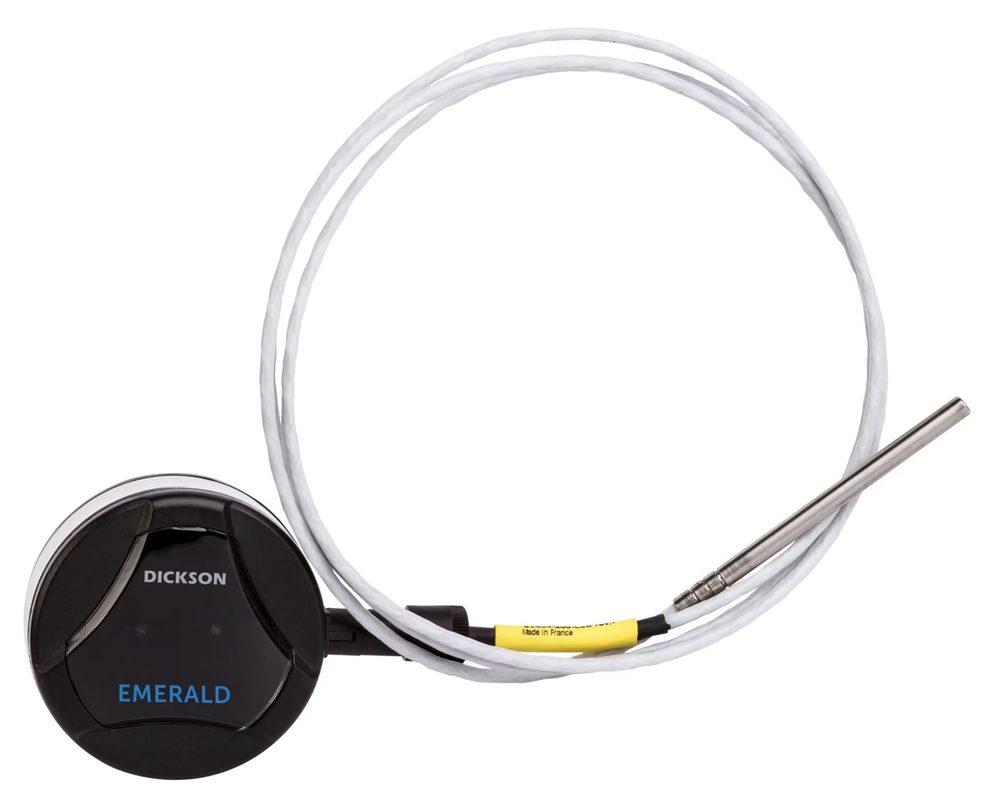
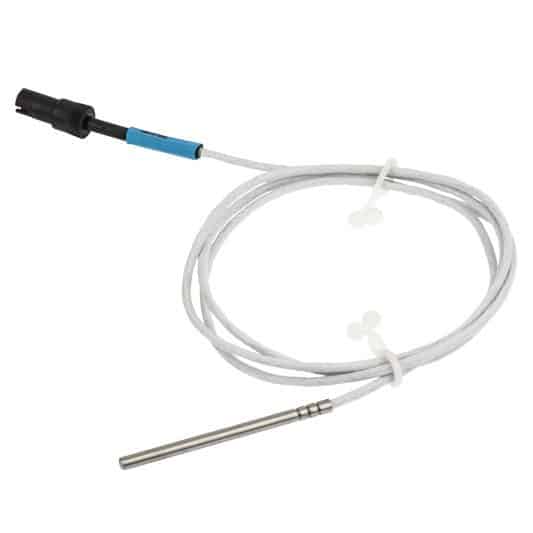
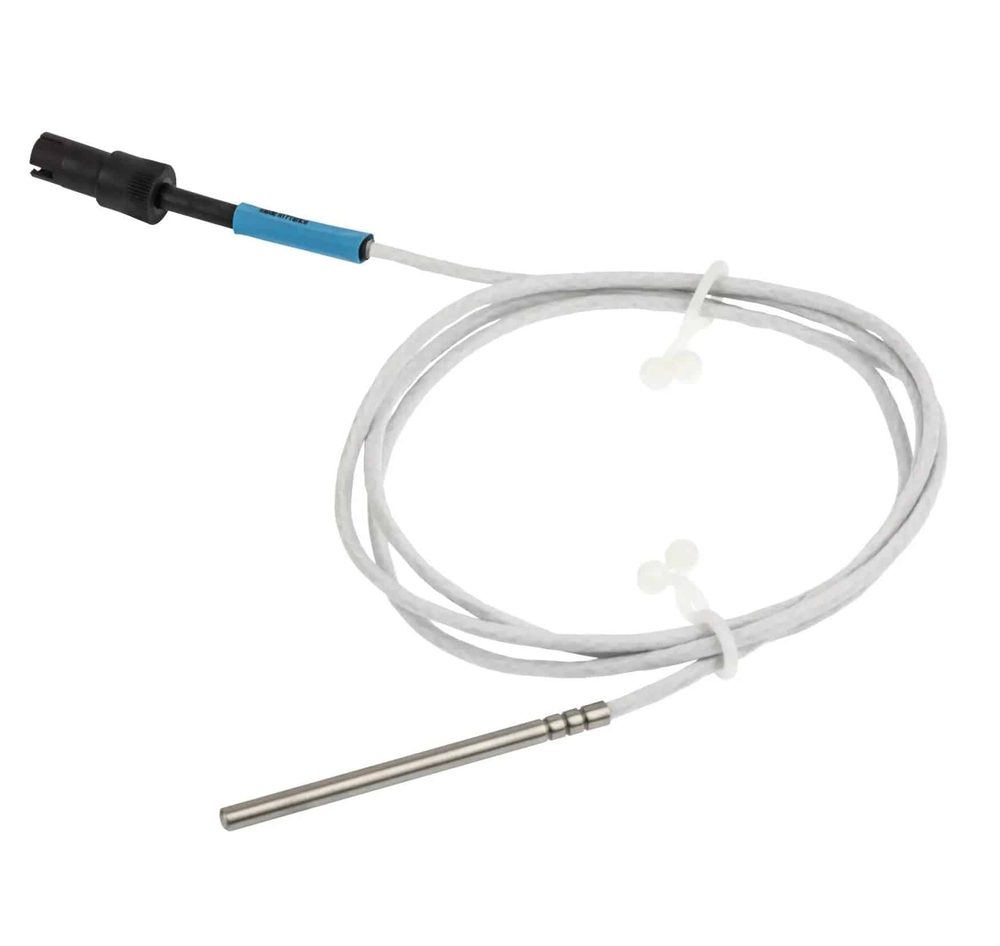
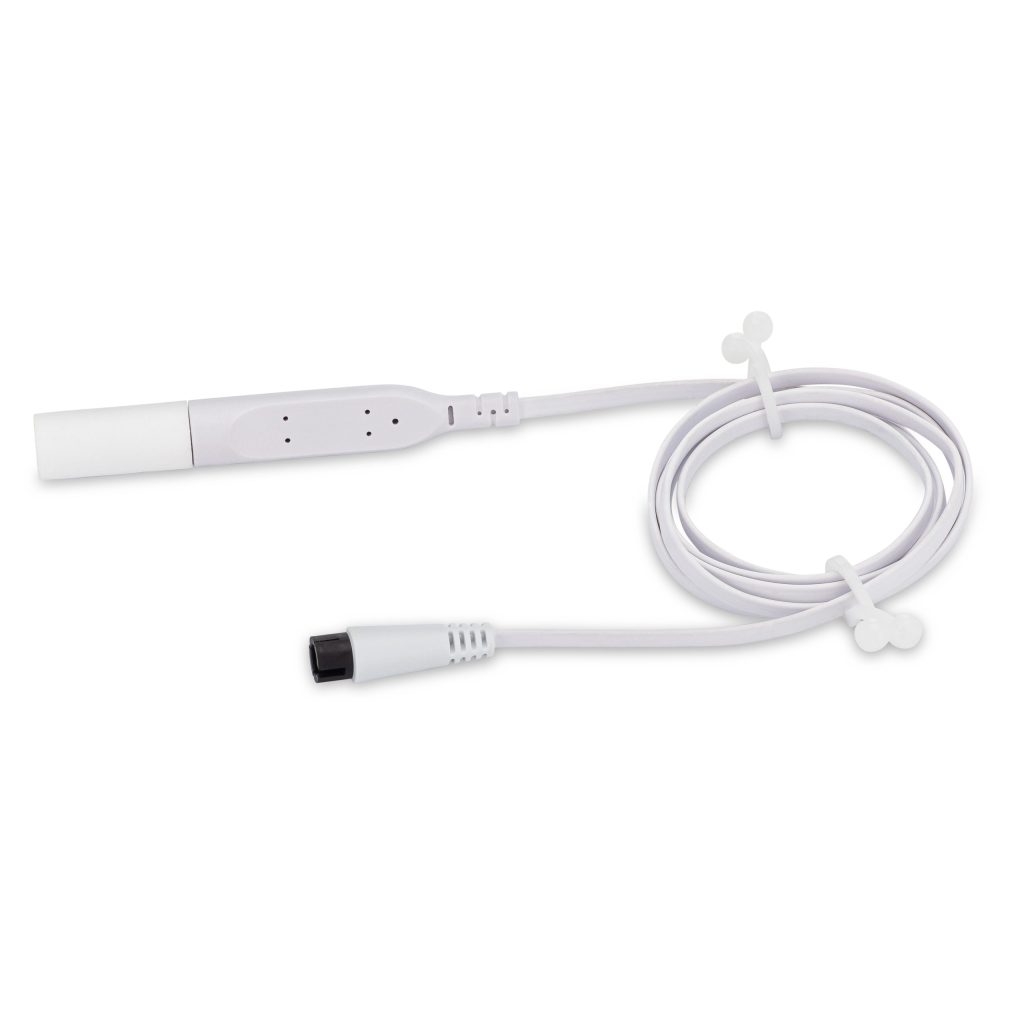
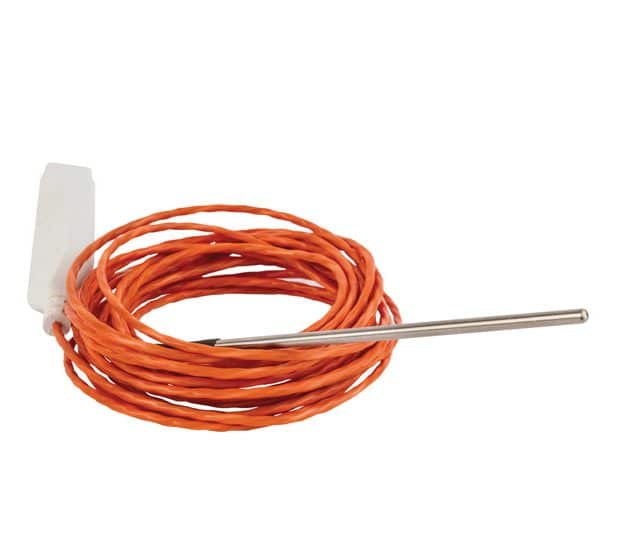
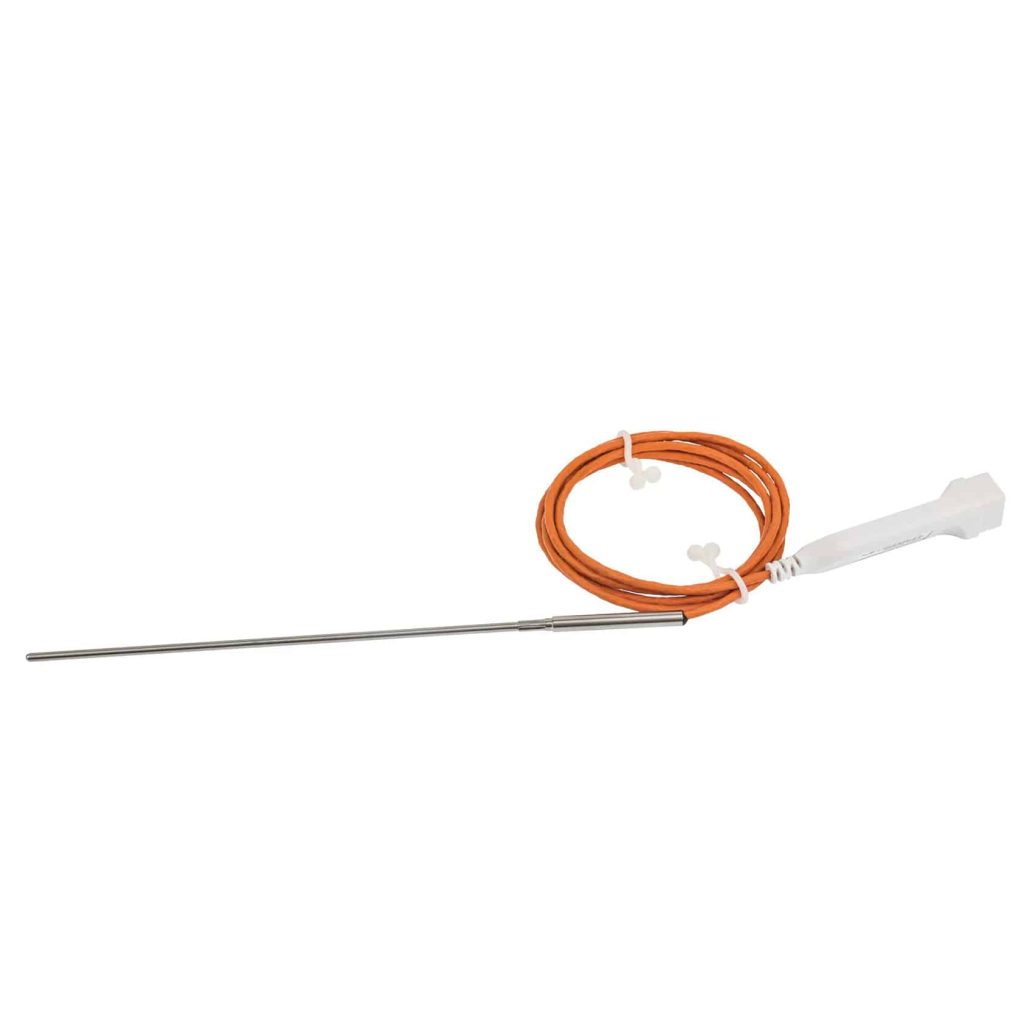
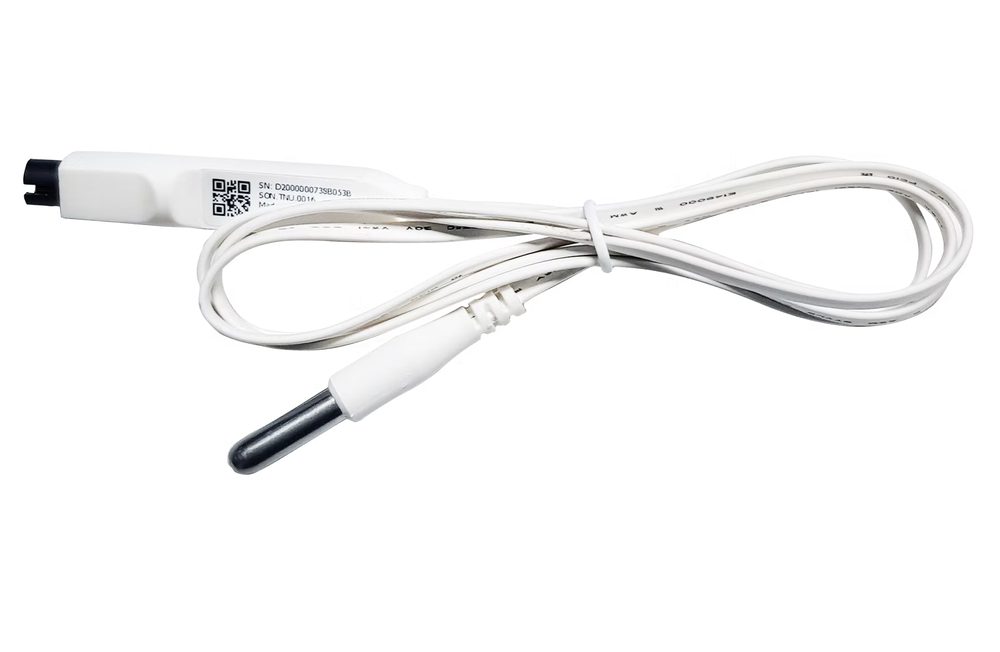
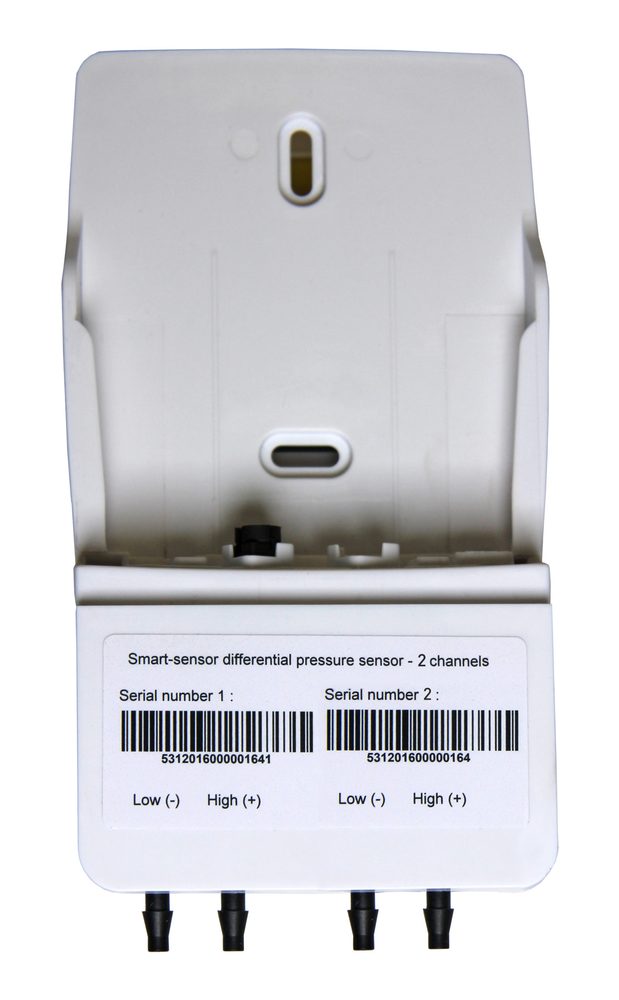
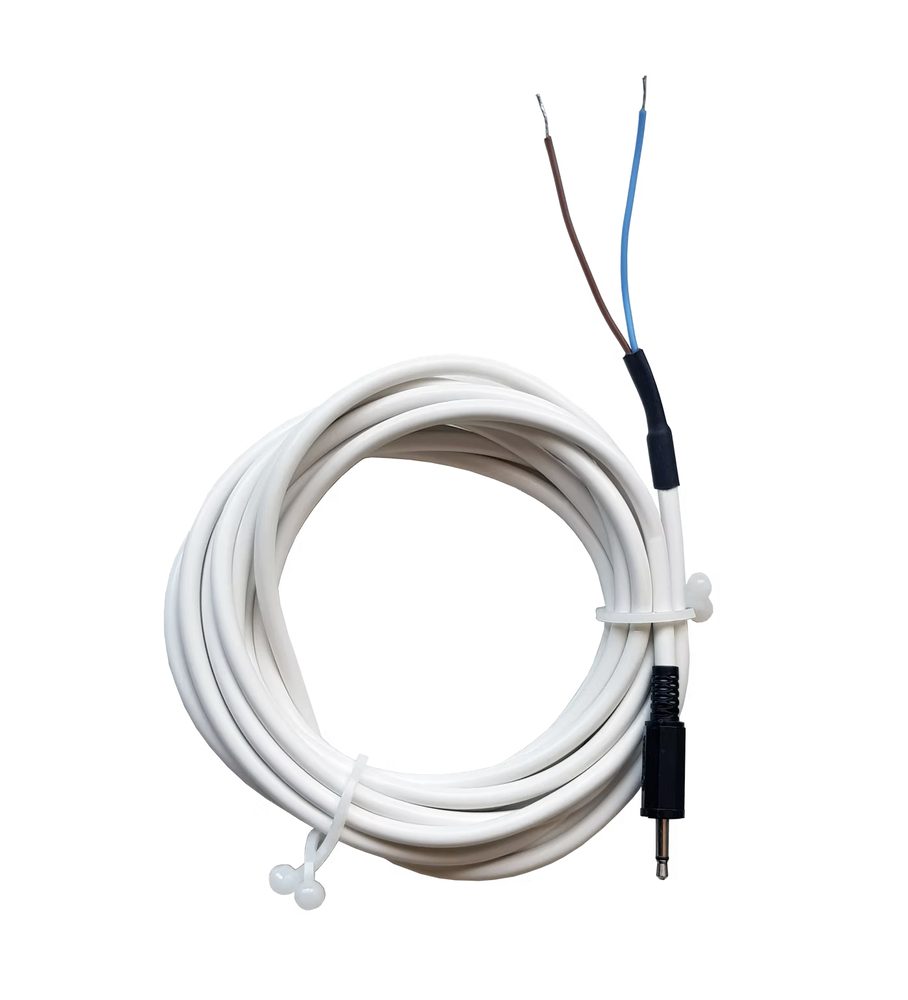
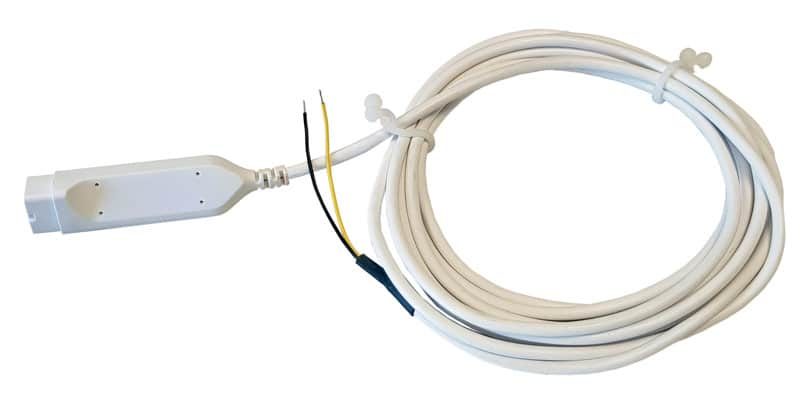
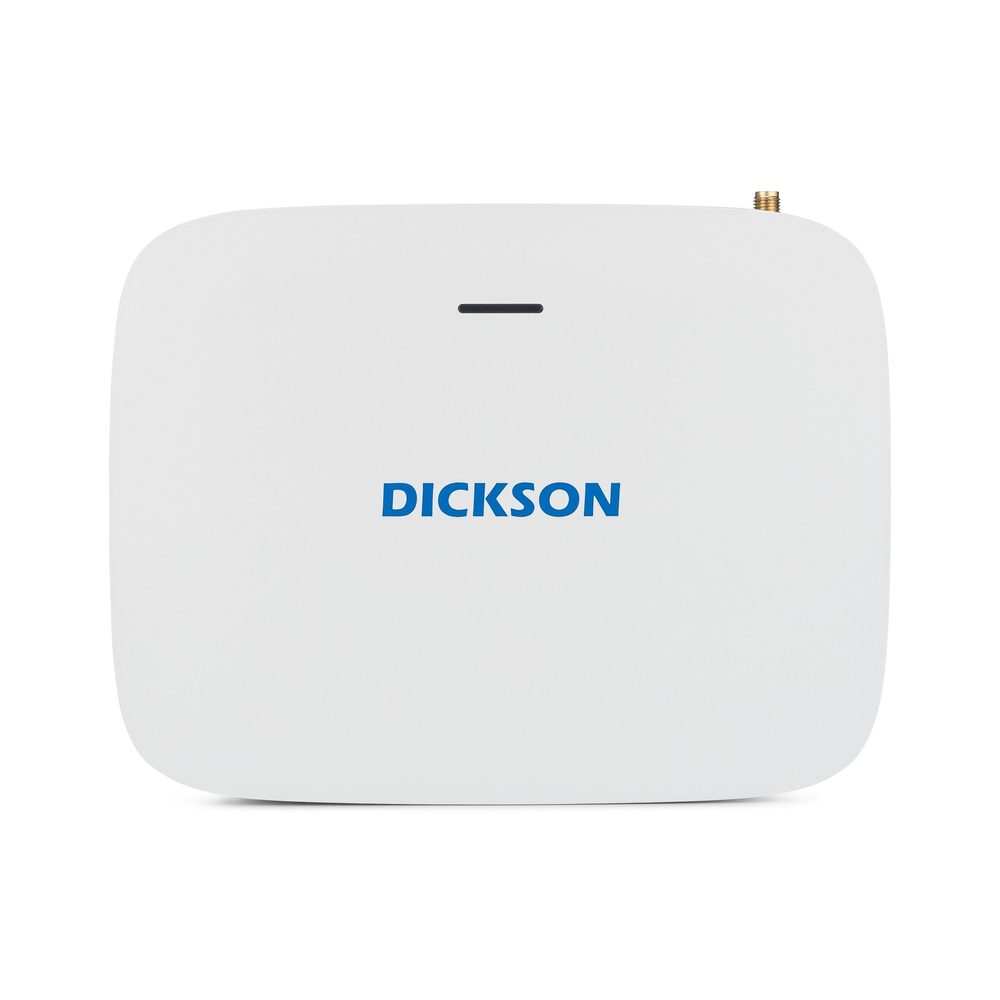
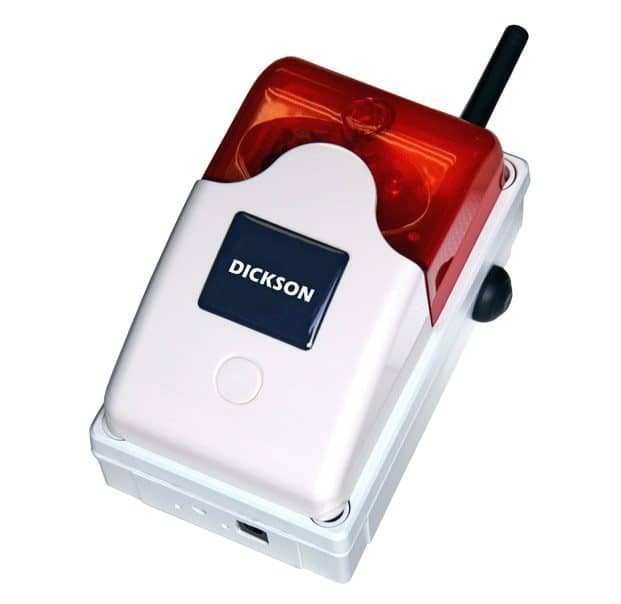
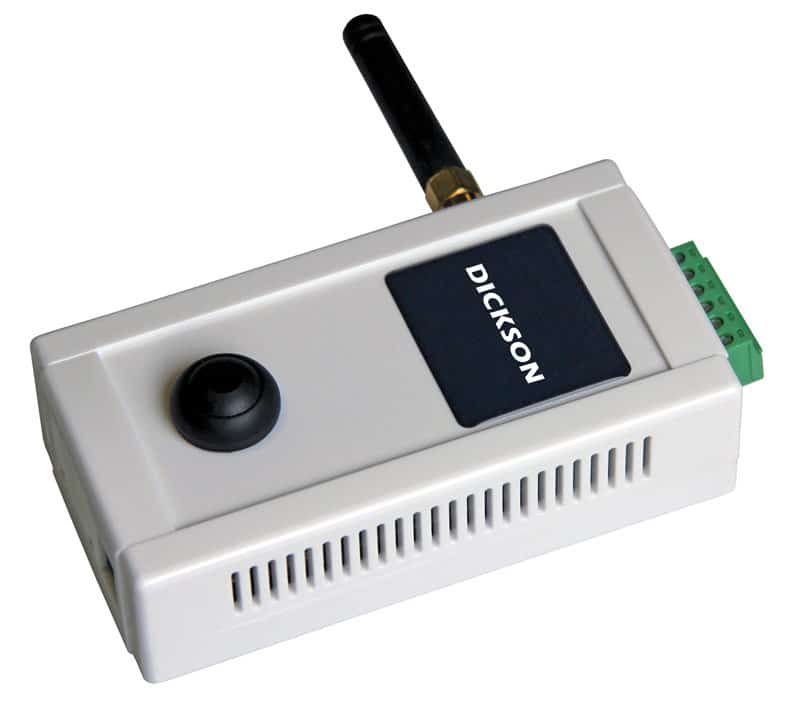


If you would like to see the prices of our products, you can log in or contact us here.


OCEAView
OCEAView is a complete platform for monitoring, traceability and alarms, in the cloud or on-premises.
It provides remote monitoring of DICKSON data loggers and environmental parameters in laboratories, warehouses, production and vehicles, among others.
Choose Cloud or On-Premises according to your security needs. The user-friendly web platform gives you control over equipment, data, sensors, users, reports and calibration, with alarms around the clock via email, phone call and SMS.
Watch mode & Plan View
Watch mode gives a quick overview of the equipment you have access to and the physical parameters the data loggers record.
With floor plans or 3D images you can easily see the location and status of the equipment.
- Overview of equipment and parameters
- Visual location and status
- Remote configuration of data loggers

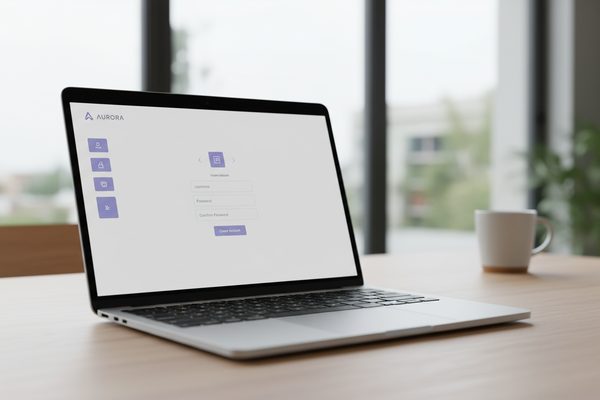
Graphs and Reports
Sensor readings are shown in clear graphs, so variations over time are easy to follow.
- See data from several sensors on the same equipment
- Automatic minimum, maximum and average values
- Scheduled reports on equipment and alarms in OCEAView
- Export data in several formats

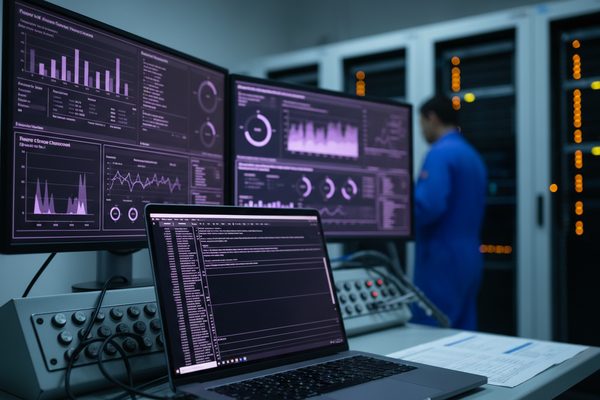
OCEAlert
All sensor readings can be shown in a graph, so variations over time are easy to follow.
- See information from several sensors on the same equipment at the same time
- Minimum, maximum and average are calculated automatically and updated when the interval changes
- Create scheduled reports on equipment and alarms in OCEAView
- Export data in several formats

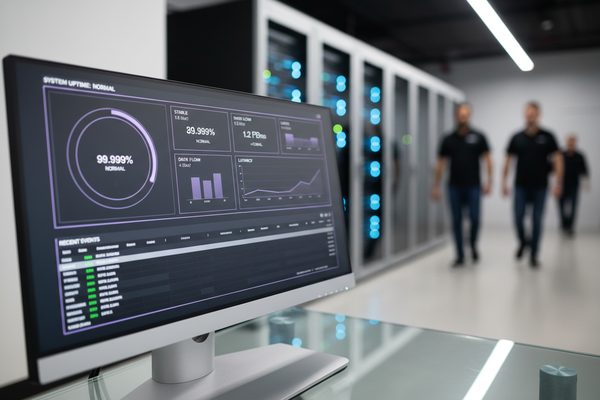
Mapping
In our experience, any type of equipment that stores critical contents, such as refrigerators, freezers or storage rooms, by no means always has an even and consistent temperature distribution throughout the area.
The question is, where should the temperature sensors be placed to ensure the product is stored under the required conditions?
Mapping reveals the conditions in the area and gives a complete picture and justification for the optimal placement of the sensors. There is no other way to ensure that the whole area is under control. Mapping matters, it is an important part of validating a room or equipment intended to store any kind of critical material! If you need a solution for temperature mapping or seasonal studies, we are more than able to help with the task.
Kom hurtigt i kontakt med den rette specialist.
Vi hjælper med alt fra nye monitoreringsløsninger til kalibrering, validering og teknisk support.
Generelle henvendelser

Nye projekter
IT & teknik
Administration
Besøg os
Måløv Byvej 229
2760 Måløv
Ring til os
+45 72 22 02 05
Man-fre, 08-16